
Many marketers believe digital marketing success stems purely from creative brilliance and intuitive hunches. While creativity matters, this mindset ignores the foundation of every winning campaign in 2026: data-driven insights from analytics. Without analytics, you’re essentially flying blind, unable to measure what works or justify marketing spend. This guide reveals how analytics transforms digital marketing from guesswork into a measurable growth engine, covering essential metrics, optimization strategies, and practical applications that drive real ROI for your business.
Table of Contents
- Understanding The Role Of Analytics In Digital Marketing
- Core Digital Marketing Metrics And Tools To Track Success
- How Analytics Drives Optimization And Growth In Campaigns
- Common Challenges And Best Practices In Leveraging Marketing Analytics
- Discover Expert Digital Marketing Solutions
Key takeaways
| Point | Details |
|---|---|
| Analytics enable data-driven strategy | Transform creative campaigns into measurable initiatives with concrete performance data |
| Core metrics track campaign health | Monitor conversion rates, CPA, CTR, and customer lifetime value to optimize spending |
| Multiple tools serve different needs | Google Analytics, HubSpot, and Adobe Analytics each provide unique channel insights |
| Testing drives continuous improvement | A/B testing and multivariate experiments refine campaigns for maximum ROI |
| Clear KPIs overcome common challenges | Standardized data sources and focused metrics solve integration and complexity issues |
Understanding the role of analytics in digital marketing
Marketing analytics encompasses the systematic collection, measurement, and interpretation of data from your digital campaigns. It transforms abstract creative concepts into quantifiable results you can track, analyze, and improve. At its core, analytics involves three fundamental components: gathering data from multiple touchpoints, analyzing patterns and trends, and reporting actionable insights that inform strategic decisions.
The power of analytics lies in its ability to reveal exactly how customers interact with your brand across every digital channel. You can trace the complete journey from initial awareness through final conversion, identifying which touchpoints drive the most value. This visibility eliminates the guesswork that plagued marketing for decades, replacing assumptions with concrete evidence about what resonates with your audience.
Consider the key performance indicators that analytics makes measurable:
- Conversion rate showing the percentage of visitors who complete desired actions
- Customer acquisition cost revealing how much you spend to gain each new customer
- Click-through rate indicating how compelling your messaging and creative assets are
- Bounce rate exposing content or user experience problems that drive visitors away
- Customer lifetime value projecting the total revenue each customer generates over time
These metrics provide the foundation for data-driven decision making that reduces reliance on intuition alone. When you know precisely which campaigns generate the highest return, you can allocate budget strategically rather than spreading resources thin across unproven tactics. Analytics reveals the truth about campaign performance, even when that truth contradicts your initial assumptions or creative preferences.
The shift from creative-only thinking to analytics-informed strategy represents the difference between hoping your marketing works and knowing it does. You gain the ability to justify every dollar spent, demonstrate clear ROI to stakeholders, and continuously refine your approach based on real customer behavior patterns rather than marketing folklore.
Core digital marketing metrics and tools to track success
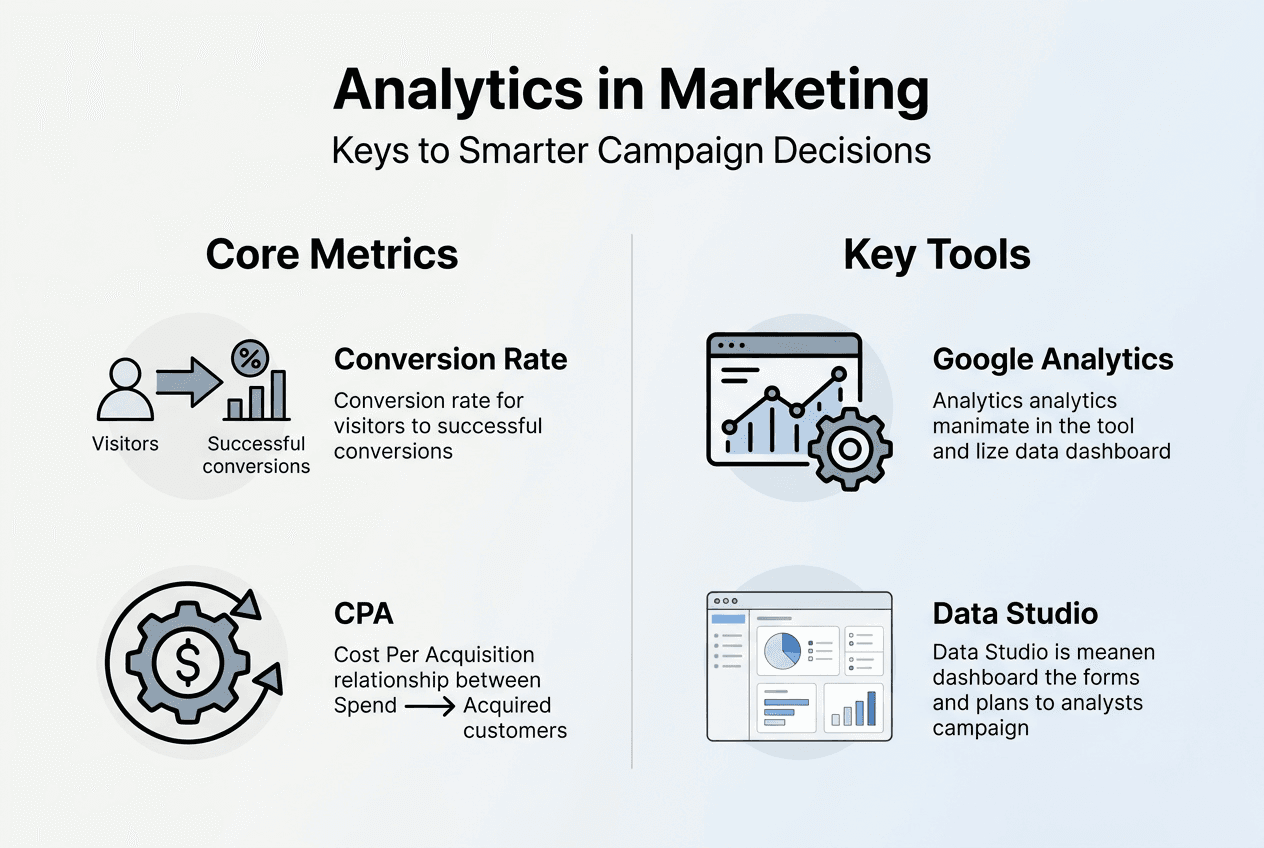
Mastering essential metrics forms the bedrock of effective analytics implementation. Conversion rate measures the percentage of visitors who complete your desired action, whether that’s making a purchase, filling out a form, or subscribing to your newsletter. This single metric reveals how well your campaigns align with audience needs and how effectively your landing pages convert interest into action.
Cost per acquisition (CPA) calculates exactly how much you spend to gain each new customer across all marketing channels. Understanding CPA alongside ROI metrics helps you identify which campaigns deliver profitable growth versus those that drain resources without adequate return. Click-through rate (CTR) shows what percentage of people who see your ads or emails actually click through, providing immediate feedback on messaging effectiveness and creative appeal.

Bounce rate indicates the percentage of visitors who leave your site after viewing only one page. High bounce rates often signal misalignment between ad promises and landing page content, poor user experience, or irrelevant traffic sources. Customer lifetime value (CLV) projects the total revenue you can expect from a customer relationship, helping you determine appropriate acquisition costs and retention investment levels.
| Tool | Primary Features | Best Use Cases |
|---|---|---|
| Google Analytics | Free comprehensive tracking, audience insights, conversion funnels | Small to medium businesses, website performance analysis |
| Adobe Analytics | Advanced segmentation, real-time data, predictive analytics | Enterprise organizations, complex multi-channel campaigns |
| HubSpot | Integrated CRM, marketing automation, lead scoring | Inbound marketing, lead nurturing workflows |
| Mixpanel | Product analytics, user behavior tracking, retention analysis | SaaS companies, mobile apps, product-led growth |
Interpreting these metrics requires context beyond surface-level numbers. A 2% conversion rate might be excellent for high-ticket B2B services but poor for e-commerce impulse purchases. Compare your performance against industry benchmarks while recognizing that your unique audience and value proposition create different expectations. Look for trends over time rather than obsessing over daily fluctuations that often reflect normal variance.
Pro Tip: Customize your analytics dashboard to display only the five to seven metrics that directly impact your specific business objectives, eliminating distracting vanity metrics that look impressive but don’t drive revenue.
Common interpretation pitfalls include confusing correlation with causation, ignoring statistical significance in small sample sizes, and focusing on metrics that don’t connect to actual business outcomes. A campaign might generate impressive traffic numbers while delivering zero revenue if those visitors don’t match your ideal customer profile. Always trace metrics back to fundamental business goals like revenue growth, customer acquisition, and profitability rather than getting lost in intermediate metrics that don’t ultimately matter.
How analytics drives optimization and growth in campaigns
Leveraging analytics for campaign optimization follows a systematic process that turns data into actionable improvements. This cycle of measurement and refinement separates high-performing marketers from those who launch campaigns and hope for the best. Here’s how to apply analytics for continuous growth:
- Establish specific, measurable goals tied to business outcomes before launching any campaign
- Implement comprehensive tracking across all customer touchpoints and conversion events
- Collect sufficient data to identify statistically significant patterns and trends
- Analyze performance against benchmarks to pinpoint underperforming elements
- Design tests to validate hypotheses about potential improvements
- Implement changes based on test results and monitor impact on key metrics
- Document learnings and apply insights to future campaign planning
A/B testing represents the most powerful application of analytics for optimization. You create two versions of a campaign element (headline, image, call-to-action, landing page layout) and split traffic between them to determine which performs better. Multivariate testing extends this concept by testing multiple variables simultaneously, revealing how different elements interact to influence conversion rates.
Successful digital marketing strategies rely on this test-and-refine approach. One e-commerce brand increased conversion rates by 34% simply by testing different product image sizes and placements based on heatmap analytics showing where visitors focused attention. Another B2B company doubled lead quality by analyzing which content topics attracted their most valuable prospects, then shifting content production to emphasize those themes.
Data-led experimentation removes ego and assumptions from marketing decisions, replacing them with evidence about what actually resonates with your audience and drives measurable results.
The key is treating every campaign as an experiment that generates learnings for future optimization. Even failed campaigns provide valuable insights when you analyze why they underperformed and what that reveals about your audience preferences. This mindset shift transforms marketing from a cost center into a strategic investment that compounds returns over time through accumulated knowledge.
Pro Tip: Integrate analytics across all marketing channels to understand how different touchpoints work together in the customer journey, revealing attribution patterns that single-channel analysis misses entirely.
Cross-channel analytics proves especially valuable as customer journeys grow increasingly complex. Someone might discover your brand through social media, research on your website, receive nurturing emails, and finally convert through a retargeting ad. Understanding this complete pathway helps you optimize the entire funnel rather than individual channels in isolation, leading to dramatically better overall performance.
Common challenges and best practices in leveraging marketing analytics
Implementing effective analytics faces several predictable obstacles that derail many marketing teams. Data silos occur when information lives in disconnected systems that don’t communicate, preventing you from seeing the complete customer journey. Marketing automation platforms, CRM systems, advertising platforms, and web analytics tools each capture valuable data, but integration challenges leave that data fragmented and difficult to synthesize into actionable insights.
Inaccurate data undermines every analysis and decision built on that foundation. Tracking code errors, bot traffic, duplicate entries, and inconsistent naming conventions all corrupt your data quality. Without clean, reliable data, you’ll draw incorrect conclusions and optimize for the wrong outcomes. Many businesses discover too late that months of campaign decisions were based on flawed tracking that misattributed conversions or double-counted revenue.
Lack of analytics expertise represents another major barrier. The tools exist and data flows in, but few team members possess the statistical knowledge and analytical thinking required to extract meaningful insights. Tool complexity compounds this challenge, as enterprise analytics platforms offer powerful capabilities that remain unused because the learning curve exceeds available training time and resources.
| Challenge | Recommended Solution |
|---|---|
| Data silos across platforms | Implement integration tools or unified analytics platforms that consolidate data sources |
| Inaccurate tracking and measurement | Conduct regular audits, validate data against known benchmarks, clean historical data |
| Insufficient analytics skills | Invest in team training, hire specialists, or partner with analytics-focused agencies |
| Tool complexity and feature overload | Start with core features, create standardized templates, document processes clearly |
| Unclear or conflicting KPIs | Establish company-wide metric definitions, align KPIs with strategic objectives |
Best practices for overcoming these challenges start with standardizing data sources and establishing clear governance around how information gets collected, stored, and accessed. Create a single source of truth by implementing data warehousing solutions that aggregate information from all platforms into one queryable database. This foundation enables accurate cross-channel analysis and eliminates conflicting reports that erode confidence in analytics.
Training your marketing team on analytics fundamentals pays dividends that far exceed the initial investment. Team members who understand statistical significance, correlation versus causation, and proper experiment design will make better decisions and ask better questions of your data. Consider bringing in external expertise initially to establish high-converting workflows and train internal staff on proper analytics application.
Choose user-friendly tools appropriate for your team’s skill level rather than selecting based solely on feature lists. The most powerful platform delivers zero value if your team can’t effectively use it. Many businesses achieve better results with simpler tools they actually leverage than with enterprise solutions that sit mostly unused due to complexity.
Establishing clear KPIs aligned with business objectives creates focus and prevents analysis paralysis. Define exactly what success looks like for each campaign type, document how you’ll measure it, and create regular reporting cadences that keep everyone accountable. Regular review of these metrics drives continuous improvement as teams spot trends, identify opportunities, and quickly address underperformance before it significantly impacts results.
Discover expert digital marketing solutions
Applying analytics effectively requires more than just understanding concepts. You need systems, processes, and expertise that transform data into consistent growth. Lind Creative specializes in building high-converting digital marketing workflows that integrate analytics at every stage, from initial strategy through ongoing optimization.
Our Growth Engine combines analytics-driven insights with automated systems that capture leads, nurture prospects, and convert customers while continuously measuring and improving performance. We don’t just set up tracking; we build complete marketing ecosystems where data flows seamlessly between platforms, providing the visibility you need to make confident decisions about budget allocation and campaign strategy.

Choosing the right foundation for your digital presence matters tremendously for analytics implementation. Our comparison of top website builders for agencies helps you select platforms that support robust tracking and integration with essential marketing tools. Quality website design isn’t just about aesthetics; it’s about creating conversion-optimized experiences that turn analytics insights into measurable revenue growth. Explore how our data-driven approach can elevate your marketing performance and deliver the ROI you need to scale confidently in 2026.
FAQ
What are the most important analytics tools used in digital marketing?
Google Analytics provides comprehensive free tracking for website performance, audience behavior, and conversion funnels, making it essential for most businesses. Adobe Analytics offers advanced segmentation and real-time data for enterprise organizations running complex multi-channel campaigns. HubSpot integrates CRM functionality with marketing automation and lead scoring, ideal for inbound marketing strategies. Your choice depends on campaign complexity, budget, integration requirements, and team expertise, though most marketers benefit from starting with Google Analytics fundamentals before adding specialized tools.
How can analytics improve ROI in digital marketing campaigns?
Analytics identify exactly which tactics, channels, and audience segments generate the highest revenue relative to cost, enabling you to shift budget toward proven performers. Continuous measurement reveals optimization opportunities you’d otherwise miss, like underperforming ad creative, high-converting content topics, or ideal bidding strategies. By tracking ROI metrics systematically, you eliminate wasteful spending on ineffective tactics and double down on what actually drives profitable customer acquisition. This data-driven allocation typically improves overall campaign ROI by 40-60% within six months.
What common challenges should I expect when implementing marketing analytics?
Data integration issues arise when marketing tools don’t communicate effectively, creating information silos that prevent holistic analysis. Skill gaps within marketing teams mean valuable data sits unused because nobody knows how to extract actionable insights from complex platforms. Tool complexity overwhelms users who abandon advanced features that could drive better results. Address these obstacles by standardizing data sources, investing in team training, and partnering with specialists who can establish proper analytics workflows and teach your team to leverage them effectively.
How often should I review and act on analytics data?
Review high-level dashboard metrics daily to spot significant anomalies or opportunities requiring immediate attention, but avoid making strategic changes based on short-term fluctuations. Conduct deeper weekly analysis of campaign performance to identify trends and optimization opportunities worth testing. Monthly comprehensive reviews should assess progress toward quarterly goals and inform budget reallocation decisions. The key is balancing responsive monitoring with patient testing, giving changes enough time to generate statistically significant results before drawing conclusions or making further adjustments.
Recommended
- Build a Results-Driven Digital Marketing Strategy 2025 – Lind Creative
- Digital Strategy: Unlocking eCommerce Growth and Automation – Lind Creative
- Top 7 digital marketing strategies for growth in 2026 – Lind Creative
- Key Digital Marketing Terms Driving Hotel Growth – Lind Creative