
Every marketing director wants data that actually helps drive better guest bookings, not just numbers on a dashboard. Yet, it can be challenging to make sense of website traffic unless your analytics tools align with your hotel’s real business decisions. By setting up robust analytics solutions and focusing on key engagement metrics, your team can uncover which marketing channels truly deliver high-value guests and where your booking process needs refinement, giving your property a competitive edge in guest acquisition.
Table of Contents
- Step 1: Set Up Robust Analytics Tools
- Step 2: Identify Key Traffic Sources
- Step 3: Evaluate Visitor Engagement Metrics
- Step 4: Spot Conversion Opportunities
- Step 5: Validate Insights for Ongoing Improvement
Quick Summary
| Key Insight | Explanation |
|---|---|
| 1. Define Data Objectives | Identify what decisions data should inform before selecting analytics tools. |
| 2. Focus on Analytics Ownership | Use open-source platforms for full data control and transparency in tracking. |
| 3. Analyze Traffic Sources | Understand which channels yield high-value bookings to optimize marketing efforts. |
| 4. Track Engagement Metrics | Measure bounce rates and session durations to assess visitor interest and satisfaction. |
| 5. Identify Conversion Barriers | Map the guest journey to discover drop-off points and optimize the booking process. |
Step 1: Set Up Robust Analytics Tools
Setting up the right analytics foundation transforms how you understand your guests and their behaviors. Before you choose any tool, start by identifying the specific decisions you need data to inform. Are you trying to understand which marketing channels drive the most valuable bookings? Do you want to know where potential guests drop off during your reservation process? By clarifying these questions first, you’ll know exactly what to measure and which analytics platform will serve your goals. This alignment between business needs and technology prevents wasted effort on tracking data you’ll never actually use.
Your hotel needs a platform that gives you complete visibility into website visitor behavior without the restrictions of proprietary software. Consider implementing open-source analytics solutions that provide full data ownership and transparency. These platforms let you track everything from which room pages receive the most attention to how visitors interact with your booking engine, while maintaining complete control over your guest data. Set up tracking for key conversion points: visits to your rates page, time spent browsing amenities, engagement with your loyalty program signup, and ultimately completed reservations. Create custom dashboards that show you the metrics that matter most to your revenue strategy, whether that’s average booking value, length of stay, or guest acquisition cost by channel.
Hiring individuals who speak both the language of data and the language of hotel business operations proves invaluable. Your analytics team should understand not just how to configure tracking parameters, but also how those metrics connect to occupancy rates and revenue per available room. When your technical team understands that a 20-percent increase in direct bookings matters more than a 50-percent increase in agency referrals, they build dashboards and reports that actually drive decisions. This bridge between analytics and business strategy ensures your investment in analytics tools delivers real returns in guest acquisition and revenue growth.
Pro tip: Start with core metrics tracking before adding advanced features. Once you’re confident in your data accuracy and actively using reports to make booking decisions, then expand to tracking patterns in unstructured data like guest reviews and social media mentions.
Here’s a comparison of leading open-source vs. proprietary analytics tools for hotels:
| Feature | Open-Source Analytics | Proprietary Analytics |
|---|---|---|
| Data Ownership | Full control by hotel | Data stored by provider |
| Customization | Highly flexible | Often limited options |
| Cost | Low or no licensing fees | Ongoing subscription costs |
| Support | Community-based, variable | Professional, responsive |
| Transparency | Source code visible | Black-box algorithms |
Step 2: Identify Key Traffic Sources
Understanding where your website visitors originate is fundamental to optimizing your guest acquisition strategy. Your analytics platform captures this data automatically, but interpreting it correctly requires knowing which sources matter most to your business and which are most reliable. Some traffic sources bring high-value guests who book directly at premium rates, while others bring curious browsers who never convert. By systematically mapping your traffic ecosystem, you gain clarity on which marketing channels deserve increased investment and which need refinement.
Start by examining the primary channels feeding visitors to your website: organic search, paid advertising, direct traffic, social media, and referral sources like travel agencies or review sites. Within each channel, dig deeper to identify specific sources. For organic search, which keywords drive the most qualified guests? For paid advertising, which platforms and campaigns generate bookings at acceptable cost per acquisition? For direct traffic, are these returning guests or new visitors finding you through word-of-mouth? The key is moving beyond surface-level numbers to understand the quality and intent behind each visitor. When evaluating the reliability of your traffic data, assess the credibility of digital sources feeding into your analytics. Cross-verify data from multiple channels to spot inconsistencies that might indicate tracking errors or misattribution. Your analytics tool itself becomes a source to evaluate: Is it properly configured? Are tracking codes firing on every page? Are you capturing UTM parameters from your marketing campaigns accurately?
Create a simple tracking system for your traffic sources using consistent naming conventions in your campaigns. When you launch a Google Ads campaign promoting your spa packages, ensure every link includes tracking parameters that your analytics platform recognizes. When you share content on social media, use unique identifiers so you can trace which posts drive actual hotel inquiries. This discipline prevents the common problem of lumping valuable bookings into vague categories like “direct traffic” when they actually came from a specific marketing investment. Over time, your data reveals patterns: maybe your Instagram audience books longer stays, or your search engine marketing attracts guests on tighter budgets. These insights allow you to build a more sophisticated guest acquisition strategy that aligns spending with results.
Pro tip: Focus first on your top five traffic sources rather than trying to analyze every referrer. Once you understand which channels truly drive bookings and revenue, expand your analysis to secondary sources and experiment with new channels strategically.
Step 3: Evaluate Visitor Engagement Metrics
Engagement metrics reveal the true story behind your website traffic. Raw visitor counts tell you nothing about whether those guests are genuinely interested in booking or simply browsing. The metrics that matter show you how visitors interact with your content, where they lose interest, and which pages convert curiosity into action. By understanding these engagement signals, you can identify which parts of your website work brilliantly and which ones need redesign or repositioning.

Focus on the core engagement metrics that speak directly to your business objectives. Start with bounce rate, which shows the percentage of visitors who land on a page and leave without exploring further. A high bounce rate on your rates page might mean your pricing presentation confuses guests or fails to showcase value. Average session duration tells you how long visitors spend on your site, and pages per session reveals how many different pages they explore. These metrics work together to paint a picture of visitor intent. A guest who spends eight minutes reviewing fifteen pages is clearly more engaged than someone who glances at your homepage for thirty seconds. Understanding Google Analytics metrics helps you contextualize these numbers with dimensions like device type, geographic location, and traffic source. A mobile visitor from California might engage differently than a desktop visitor from Canada. Perhaps your mobile experience needs improvement, or perhaps you’re attracting the wrong audience through certain advertising channels. These insights shape smarter marketing decisions.
Go beyond the numbers to understand what engagement means for your specific guests. Don’t just count sessions; analyze visitor behavior patterns across different audience segments. Which types of guests spend more time exploring your amenities? Who views multiple room categories before booking? Where do international guests versus domestic guests drop off in the journey? This segmentation reveals which marketing messages resonate with different audiences and which pages need improvement for specific guest types. Combine your quantitative data with qualitative feedback by monitoring guest reviews and inquiries to understand satisfaction patterns. When you see that guests frequently ask about parking but struggle to find that information on your website, you’ve identified an engagement problem worth fixing. This blend of metrics and real-world feedback creates a complete picture of your visitor experience.
Pro tip: Track engagement separately for new versus returning visitors. Returning guests might have lower bounce rates because they know exactly where to book, while new prospects need more time to explore and build trust. This distinction helps you optimize your site for different visitor stages.
This summary helps you quickly understand core website engagement metrics and their business implications:
| Metric | What It Measures | Business Insight |
|---|---|---|
| Bounce Rate | Visitors leaving after one page | Indicates page relevance or confusion |
| Avg. Session Duration | Time spent on site per visit | Reflects visitor interest level |
| Pages per Session | Average number of pages viewed | Shows if guests explore offerings |
| Conversion Rate | Visitors who complete booking actions | Directly tied to revenue growth |
Step 4: Spot Conversion Opportunities
Conversion opportunities hide in plain sight within your analytics data. Most hotels focus on total bookings without examining where potential guests abandon the journey. Your website might attract thousands of visitors monthly, but if only a small percentage complete reservations, you’re leaving significant revenue on the table. By analyzing where visitors drop off and why, you unlock opportunities to turn curious browsers into paying guests.
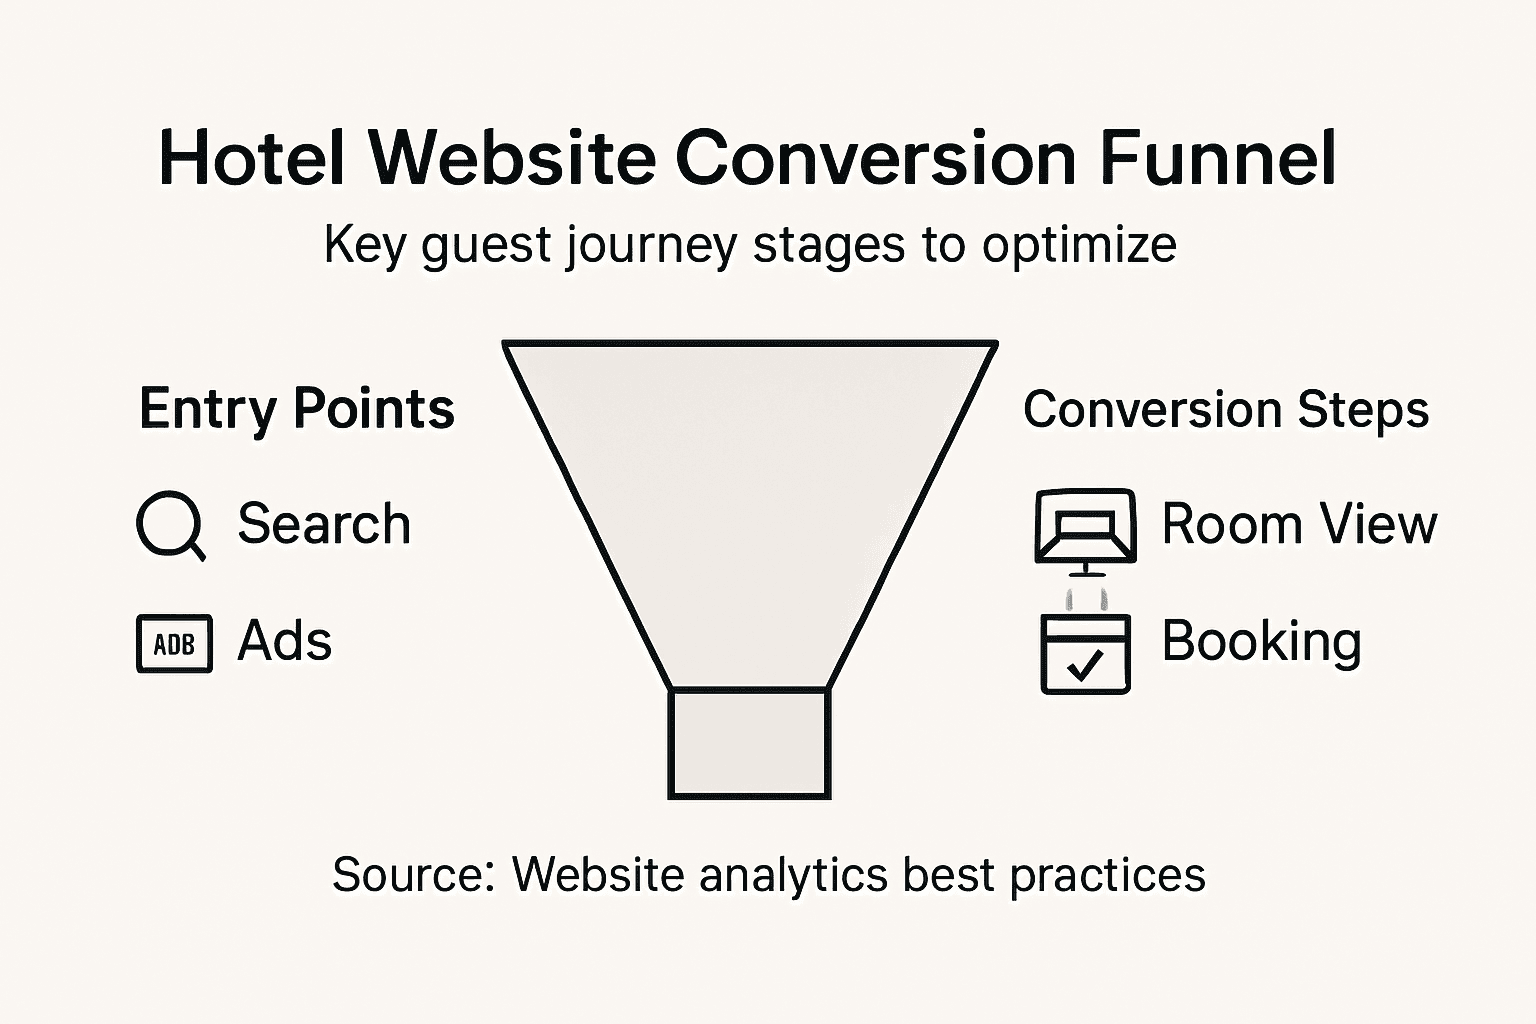
Start by mapping your guest journey from first click to completed booking. A visitor arrives through Google search, browses your room categories, checks availability for their dates, views pricing, begins the reservation process, and either completes the booking or exits. Each step is a potential conversion point or drop-off moment. Understanding conversion rates means examining what percentage of visitors complete each step. If 50 percent of visitors view your rates but only 10 percent proceed to the booking form, you’ve identified a significant friction point. The problem might be that your pricing lacks context, your room descriptions fail to highlight unique features, or your booking interface feels complicated. Maybe guests don’t understand what amenities are included at each price point, or they’re comparing your rates to competitors without seeing your value proposition clearly. By pinpointing these exact moments when visitors hesitate or leave, you can test improvements and measure their impact on conversions.
Analyze your conversion funnel to identify drop-off points where visitors most frequently exit. A typical hotel funnel might look like this: homepage view to rates page visit, rates page to room detail page, room detail to availability check, availability to booking form, and booking form to confirmation. Track the percentage of visitors progressing through each stage. If you notice that visitors frequently exit after checking availability, the problem might be that your calendar interface is confusing or that your pricing suddenly jumps for certain dates without explanation. Perhaps your booking form requires too much personal information upfront, or your payment options are limited. Each conversion opportunity represents a chance to improve your guest experience while simultaneously increasing revenue. Small improvements compound quickly. Improving your booking form to load 30 percent faster might increase conversions by 5 percent. Simplifying your room selection interface could reduce abandonment by another 3 percent. These seemingly small gains translate into meaningful increases in bookings and revenue.
Pro tip: Focus your optimization efforts on the pages with the highest traffic but lowest conversion rates. A page with 100 visitors and 5 percent conversion generates five bookings, while a page with 1,000 visitors and 2 percent conversion generates only twenty. Improving that second page from 2 to 4 percent conversion doubles your results without requiring traffic increases.
Step 5: Validate Insights for Ongoing Improvement
Data tells a story, but not every story is true. You might notice that guests who visit your spa page book longer stays, but correlation doesn’t equal causation. Perhaps those guests already planned extended visits and naturally explored more pages. Or maybe you’re comparing data from different seasons when booking patterns naturally shift. Validating your insights means questioning your findings, testing your assumptions, and ensuring your conclusions actually drive better decisions for guest acquisition and revenue growth.
Start by examining the context and limitations of your data. When you discover that your Instagram traffic converts at twice the rate of Facebook traffic, dig deeper before reallocating your entire marketing budget. Ask whether the two audiences are comparable. Maybe your Instagram followers are existing guests who already know your property and book readily, while your Facebook audience includes cold prospects unfamiliar with your brand. Perhaps your Instagram posts link directly to specific room categories while Facebook posts link to your homepage, explaining the conversion difference. Validating and interpreting data requires clarity on what questions you’re trying to answer and honest acknowledgment of what your data can and cannot tell you. Before making major decisions based on analytics, involve your reservations team, your marketing staff, and your management to discuss whether the insights align with what they’re seeing in real-world guest interactions. Your front desk team might report that many callers mention finding you through Google search, but your analytics show organic search traffic as only 15 percent of total visitors. This discrepancy suggests a tracking issue that needs investigation. Your reservations team’s ground-truth perspective validates or challenges what your data suggests.
Build improvement cycles around your validated insights. Once you confirm that a particular finding is reliable and meaningful, test improvements based on that insight. If your data clearly shows that mobile visitors abandon the booking process at higher rates than desktop visitors, invest in mobile optimization. Measure whether that improvement actually increases mobile conversions. Document your results and share them across your team. Ensuring analytics translates into actionable decisions requires continuous feedback loops where your entire organization learns from what the data reveals. This cross-functional approach transforms analytics from a reporting function into a strategic advantage that continuously improves guest acquisition and retention.
Pro tip: Test one insight at a time and give it sufficient time to generate meaningful results before declaring success or failure. A booking page redesign needs at least two full weeks and ideally a full month of data to account for seasonal variations in guest behavior and booking patterns.
Unlock the Full Potential of Your Website Traffic with Expert Digital Solutions
Analyzing website traffic to boost guest acquisition requires precise insight and strategic action. If you struggle with identifying key conversion opportunities or translating complex engagement metrics into real results the solution lies in combining data-driven strategy with expert website design and development. The article highlights challenges like tracking visitor behavior accurately and optimizing conversion funnels which directly impact your hotel’s ability to attract and retain guests.
At Lind Creative we specialize in helping businesses conquer these challenges through tailored Web Design – Lind Creative and Web Development – Lind Creative services. Our Growth Engine marketing system automates lead capture and campaign tracking so you gain clarity on guest acquisition sources and visitor engagement without guesswork.

Don’t leave revenue on the table with guesswork or ineffective analytics. Visit Lind Creative today and discover how our strategy-driven design and marketing solutions empower your team to make data-backed decisions that convert visitors into loyal guests. Start building your high-performing website and marketing system now to capture measurable growth and real return on investment.
Frequently Asked Questions
How do I set up analytics tools to track website traffic for guest acquisition?
To set up analytics tools effectively, first identify the specific decisions your hotel needs data to inform. Choose an analytics platform that captures key conversion points, such as room page visits or completed reservations, and set up tracking to monitor these metrics consistently.
What traffic sources should I analyze for better guest acquisition?
Focus on primary traffic sources like organic search, paid advertising, and social media to understand where your visitors are coming from. Analyze these channels to identify which bring the most valuable guests and adjust your marketing strategy accordingly.
How can I evaluate visitor engagement metrics for my hotel website?
Evaluate core engagement metrics such as bounce rate, average session duration, and pages per session to gauge how visitors interact with your content. Assess these metrics regularly to identify areas for improvement, aiming to reduce your bounce rate by 10% within the next month.
What steps should I take to find conversion opportunities on my website?
Map your guest journey and identify where visitors drop off in the booking process. Analyze each step’s conversion rates to pinpoint friction points, then implement targeted changes to improve these areas and aim for an overall conversion rate increase of 3-5%.
How do I validate insights from my analytics data to ensure accurate conclusions?
To validate insights, consider the context of your data and involve your reservations team in discussions about findings. Test one insight at a time, allowing at least two weeks for measurable results, to ensure that changes truly enhance guest acquisition strategies.
What core metrics should I focus on to drive better guest acquisition?
Concentrate on metrics like conversion rate, bounce rate, and average session duration as they directly impact guest acquisition. Use these metrics to inform your decisions, aiming to enhance your website’s performance over the next quarter for improved guest engagement.
Recommended
- How to Optimize Hotel Website for Higher Bookings – Lind Creative
- How to Optimize Website Conversions for eCommerce Success – Lind Creative
- What Is a Landing Page and Its Impact on Hospitality Leads – Lind Creative
- How to Create Service Landing Page for Lead Generation – Lind Creative